October 29, 2019 | |
 Download PDF
Commentary Glossary :
- 5+7 Forecast: Full year forecast conducted in August, based on 7 months actual results and 7 months forecast. Also called ‘summer forecast’
- A&P: Advertising and Promotion spend
- AR/AP: Accounts Receivable (money owed to us)/Accounts Payable (money we owe)
- EAC: Expenses Affecting Comparability (i.e. one-off, non-repeating costs/income)
- EBIT: Earnings (profit) before interest and Tax.
- FC1: Full year forecast conducted in April, based on 2 months actual results and 10 months forecast
- FC2: Full year forecast conducted in September, based on 8 months actual results and 4 months forecast
- FX: foreign currency movements
- KPI: Key Performance Indicator.
- Net Sales: Sales to customers less rebates and discounts
- OCF: Operating Cashflow (excludes interest and taxes paid).
- P9: September
- YTD: Year to Date.
- YTG: Year to Go.
End of Q3 financial performance exemplifies the financial turnaround that is well underway despite Net Sales being -4.2% vs the same period in 2018. On the primary financial KPIs (EBIT and OCF) we are focused on in 2019:
- EBIT is +£10.7m vs the same period in 2018 (including +4ppt of margin and £8.8m reduction in Opex)
- Operating Cashflow (OCF) is +£20.6m vs the same period in 2018 (including £7m reduced investment in working capital)
Measuring against our 5+7 forecast, P9 YTD performance is tracking very favourably on both EBIT and OCF, with Net Sales being significantly behind forecast (and we will see a fair portion of this shortfall reflected in FC2):
- Net Sales of £107,168k, decrease by -£4,126k (-3.7%) vs 5+7 – main variances are:
- France, -£1.3m, mass market declines, Cultura large scale de-stocking
- US, -£1.7m, losses incurred over Q3 due to warehouse start-up challenges
- EBIT of +£3,529k, increases by +£2,128k vs 5+7
- -0.2ppt margin decrease generates gross profit of -£1,849k vs 5+7 (sales decline, increased obsolescence provision, lower efficiencies in Le Mans and CTAM due to lower volumes)
- Opex shows £3,023k decrease vs 5+7 including £938k reduced A&P (savings and phasing that reflects sales profile) and £2,085k reduced overheads (US -£0.5m due to open position savings, travel savings; across CIHL functions -£0.5m; and -£0.7m from tight Opex control across operations sites – Le Mans £0.3m, £0.3m Huaibei rent provision released)
- Other income and expense shows +£318k vs 5+7 (largely variations in FX transactions)
- EAC reduced by £636k vs 5+7 due to sale of Souza painting
- OCF of -£4,118k shows increase of +£1,606k vs 5+7
- EBITDA +£1,980k vs 5+7
- Working capital increase of -£556 vs 5+7
- Inventory increase +£1,658k vs 5+7 – impact by lower YTD sales, Brexit buffer in DC2 and additional Arches purchases
- AR decrease of +£3,561k – consequence of reduced Q3 sales, with on-going focus on collections
- AP decrease of -£1,236k. as a result of lower purchasing (managing volume decreases), re-phasing of A&P and lower overheads
- Other current payables/receivables decrease of -£1,224k as result of reduced rebate accrual in line with lower sales and/or amendment to terms (including -£0.6m in France) and VAT outflows.
- Capex of +£314 vs 5+7 plus capitalised merchandising materials of -£161k vs 5+7
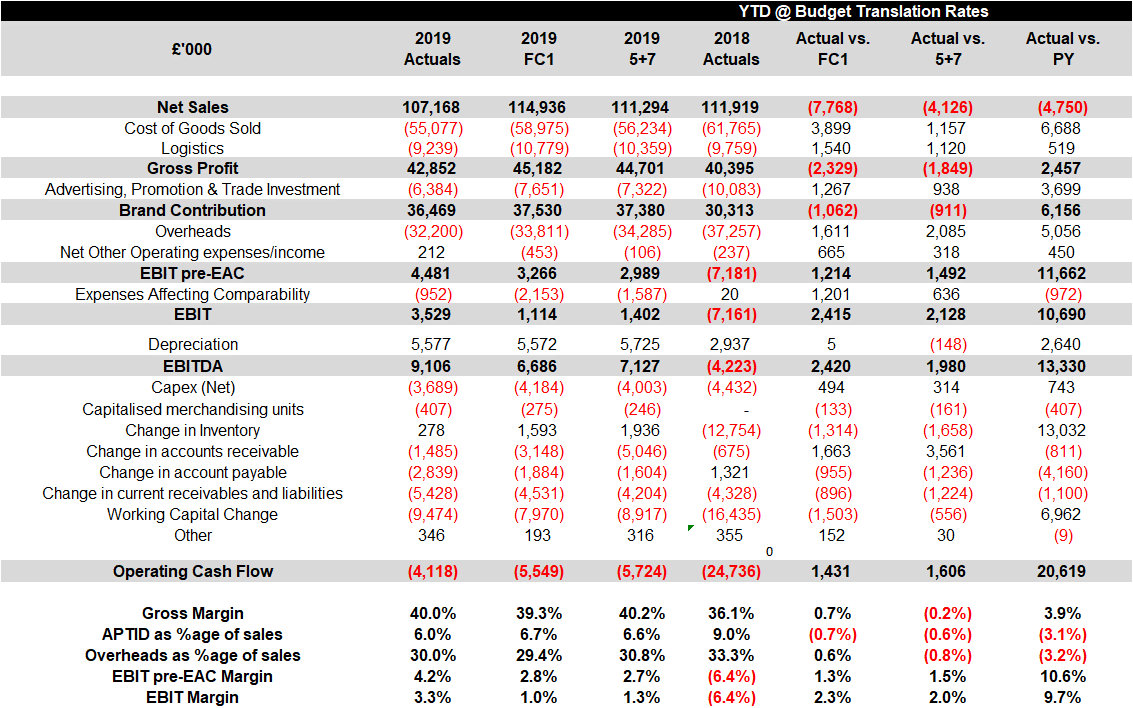
Full details of P9 YTD performance: