Finance Performance Results – 2023:FC2
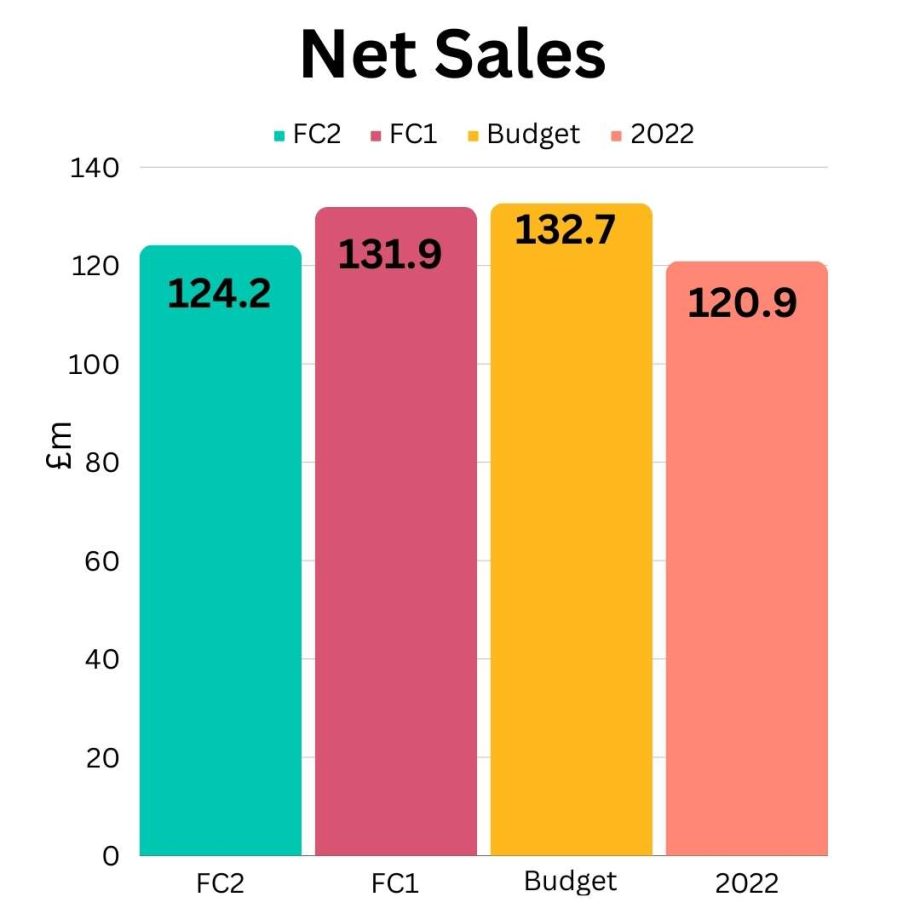
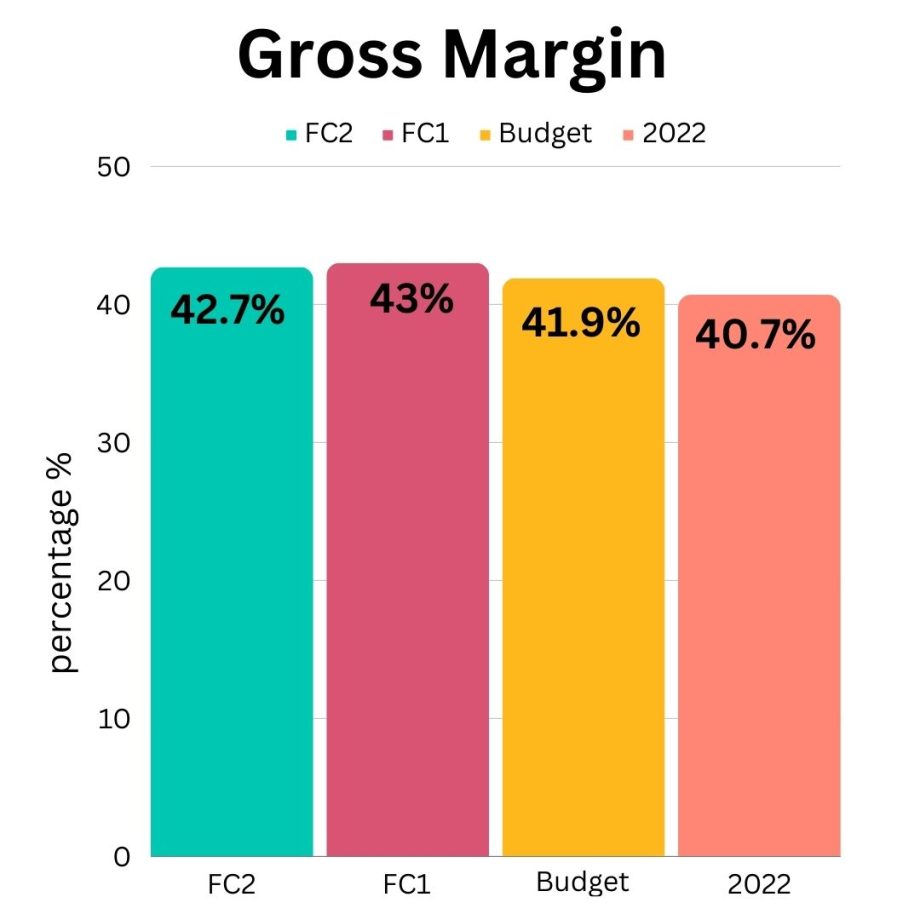
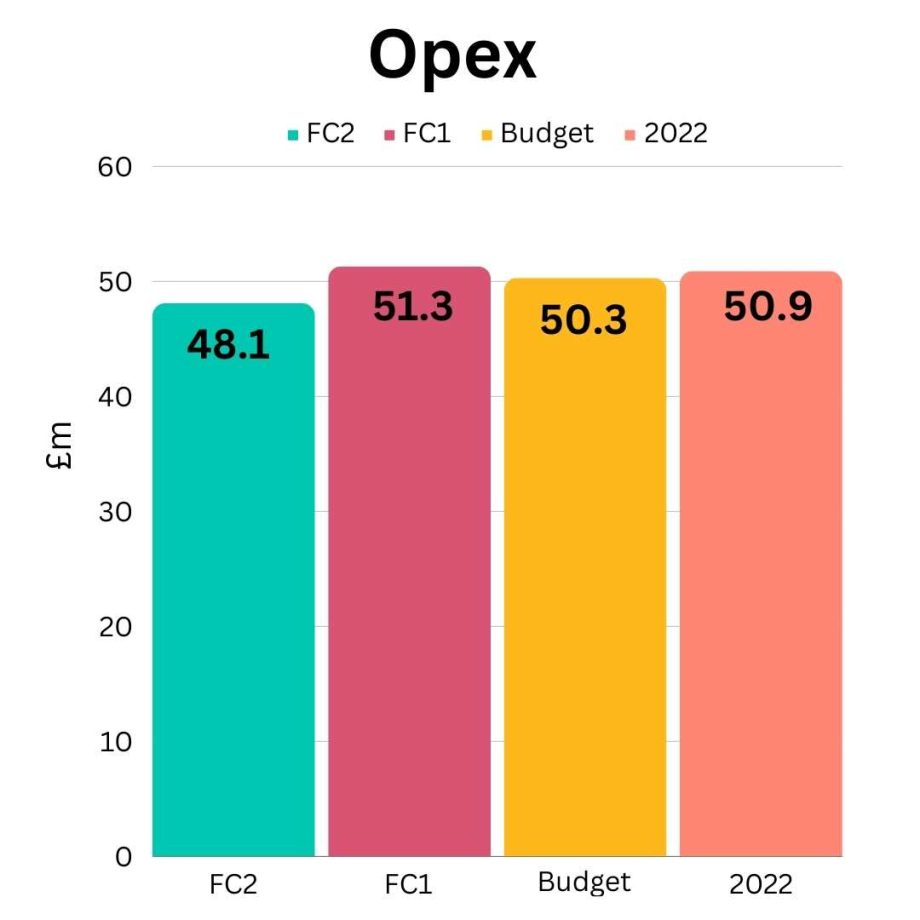
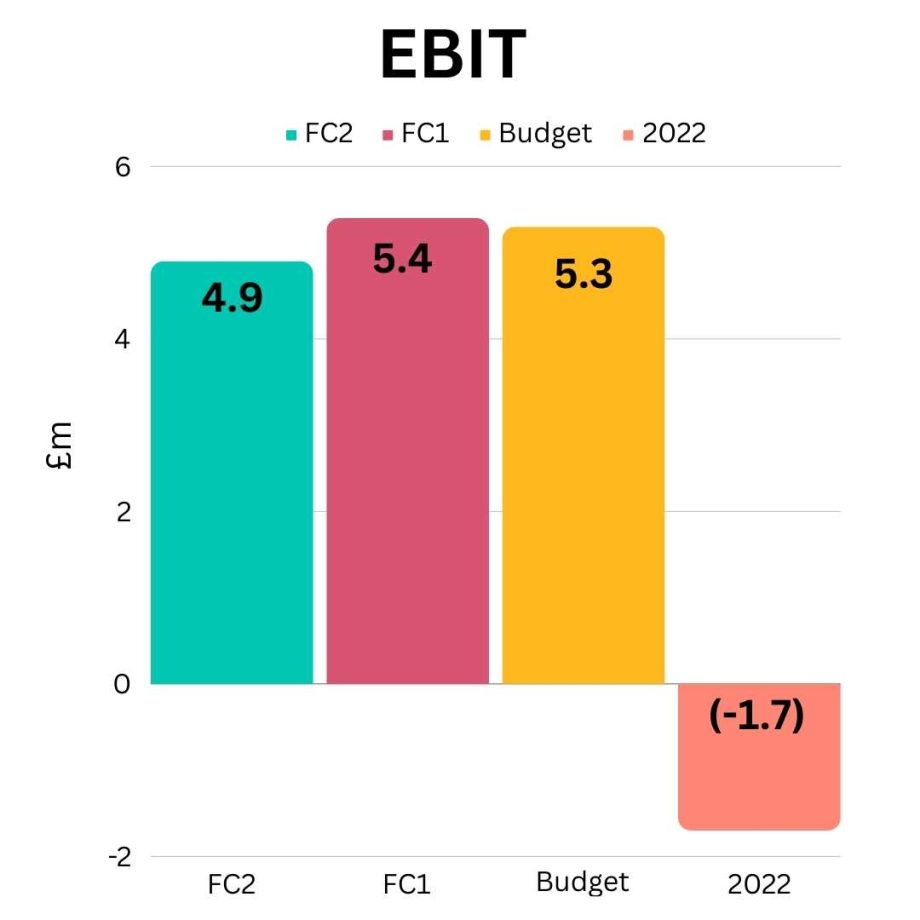
FC2 is an important forecast as it provides a view on where we expect to be financially at the end of the year based on more than half of the year being actual results. We base FC2 on 8 months of actual results and 4 months of forecast results. In principle this means we have less forward-looking assumptions to make but this does not seem to make the forecast any easier than say FC1 where we have 10 months to forecast.
Although we do a lighter touch forecast mid-year FC2 is the only other forecast we do after FC1 in April. The other important aspect of FC2 is that it forms the base point for the following year’s budget so assumptions made in FC2 will have an impact on budget, and the timelines for FC2 and Budget run very close together.
This year the process has been more complicated than usual (although there never seems to be an “easy” year). Business Units prepare their FC2s across September and early October and present their plan to the GLT in mid-October, after which we add up the numbers and conclude on a final position. That’s the theory!
Our business performance during the last few months has been quite volatile and therefore difficult to forecast even in the short term. New news on sales has never been far away and even as Business Units presented their FC2 plans we were aware of significant changes that we would need to build into the Group plan.
Kind regards,
Jonathan Spight,
Chief Financial Officer
Net Sales
Net Sales are forecast to decline by £7.7m (-5.8%) vs FC1. All of our Commerical Business Units are forecasting reduced sales vs FC1 with on-going cost of living challenges facing our consumers and the associated price attractiveness of increasing private label offerings having global impacts. The most affected markets being:
- Southern Europe, in particular France, where we are seeing continued challenges in the mass market and on the promarker range where competition has increased significantly in recent times
- International where reduced consumer demand has had a delayed impact on Colart as we work through distributors to reach retailers – the infrequent purchase pattern that comes with International customers means that there is more risk that missed orders fall into the following year
- North America where we are in an evolving discussion with our key customer (Michaels) in terms of pricing and volume of purchases
Looking at Net Sales vs 2022 we are forecasting a £3.3m (+2.7%) increase, although 2022 was heavily impacted by post-pandemic retailer destocking so the expected bounce-back has been less than expected as global inflation has remained high.
Gross Margin
Gross Margin is forecast to be relative stable vs FC1, with FC2 forecasting a 0.3ppt reduction to 42.7%.
We are seeing raw material and freight costs reducing but the impact of this is offset by the consequence of the sales reduction on our production and distribution volumes (and our need to optimise inventory as we aim to reduce our net bank debt).
Making fewer products means that we have significant spare manufacturing and distribution capacity, with a semi-fixed cost base in our manufacturing sites. This means that each product we make costs more to produce and as such offsets the lower input costs.
Optimising fixed costs based on the expected sales profile of our global business is and will continue to be a major theme as we progress the Perform 2030 strategy.
Operating Expenses (Opex)
Opex (marketing spend and overheads) is forecast to reduce by £3.2m vs FC1 in order to offset the impact of lower sales at adverse margin (totalling £3.7m less Gross Profit). These reductions were wide-ranging covering: (i) postponement or cancellation of strategic projects and reduced marketing and brand activities, (ii) not replacing certain leavers and restructuring functions and (iii) elimination of elements of the business performance incentive costs.
Earnings before Interest and Tax (EBIT)
Opex savings reduced the impact of the £3.7m lower Gross Profit to leave EBIT £0.5m adverse to Budget at a profit of £4.9m. This represents 4% of Net Sales, in line with the same measure in Budget.
Operating Cashflow (OCF)
OCF is forecast at £12.0m, in line with FC1, driven by:
- EBIT of-£4.9m, leading to Earnings before Interest, Tax, Depreciation and Amortisation (EBITDA) of £11.4m as we exclude £6.5m of (non-cash) depreciation
- Capex is forecast at £1.4m, a low level vs Colart’s part but in line with Budget
- A decrease in working capital vs 2022 of £1.9m which releases cash tied up
- a forecast reduction in inventory of £4m (cash inflow) as part of our journey to optimise inventory (and inventory location) after the unplanned increase in 2022
- a forecast decrease in amounts owed by customers (cash outflow) of £1.2m as a result of selling less products
Handy Tips Relating to this Article
- Definitions to finance technical terminology can be found by reviewing the Finance Terminlogy lesson on Colart Academy, by clicking here: https://intranet-old.colart.com/en/lessons/lesson-11/ Note if you have not previously registered for the Finance for Non Finance course in Colart Academy, then register first to allow you access to Finance Terminlogy, by clicking the following link: https://intranet-old.colart.com/en/courses/finance-for-non-finance/
- A reminder that the Business Dashboard is updated each month and includes the previous months Finance figures. You can view the dashboard by clicking the following link: https://intranet-old.colart.com/en/business-dashboard-2-0-october-2022/