


 Download PDF
Glossary
5 + 7 Forecast: Full year forecast conducted in August, based on 7 months actual results and 7 months forecast. Also called ‘summer forecast’.
Adverse: lower or worse than expected/forecasted.
AR/AP: Accounts Receivable (money owed to us)/Accounts Payable (money we owe).
EAC: Expenses Affecting Comparability (i.e. one-off, non-repeating costs/income).
EBIT: Earnings (profit) before interest and Tax.
FC1: Full year forecast conducted in April, based on 3 months actual results and 9 months forecast.
GRNI: Goods Received Not Invoiced (recognises that a liability has been incurred where an invoice has yet to be received).
H1: First 6 months of the year.
H2: Second 6 months of the year.
IFRS: International Financial Reporting Standards (provide a common global language for business affairs so that company accounts are understandable and comparable across international boundaries).
KPI: Key Performance Indicator.
OFC: Operating Cashflow (excludes interest and taxes paid).
PPV: Purchase Price Variance (a measure of how much an item cost against its expected cost).
YTG: Year to Go.
Dear Colleagues,
Overview
In this update you will see our financial performance from 2019 FC1 conducted over the spring and presented to the Board in late May.
The first thing to note is that 2019 Budget has been restated for the impact of IFRS 16 which creates fixed assets and multi-year liabilities for what were previously called operating leases. This change has no overall cash impact though it does impact the different dimensions of cashflow reporting. EBIT is restated to £0.69m from £0.27m and OCF restated from £2.44m to £5.47m.
The key FC1 brand assumptions for FC1 were:
Reeves – Business As Usual sales (5+7 forecast will reflect detailed customer conversations) with provision made for unsaleable inventory in FC1
Arches – Business As Usual sales (5+7 forecast will reflect detailed customer conversations) with rundown of inventory by year end in FC1
Key FC1 messages
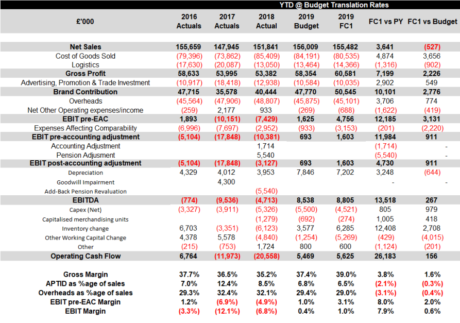
- FC1 net sales of £155.5m, £0.5m below budget – YTG recovery expected, especially in the US
- Gross Margin improves by 1.6ppt driven by reduced US duties (vs Budget), pricing and mix and CTAM down-sizing (separated in FC1 from down-size costs in EAC)
- Margin improvement and Opex reductions offset impact of Net Sales shortfall – EBIT at +£1.6m favourable to Budget by £0.9m (+£3.1m pre EAC vs Budget)
- OCF +£5.6m (+£0.1m vs Budget) with an adverse position on debtors offset by inventory and other working capital movements and reprioritised Capex
FC1 review
- FC1 has recently been concluded and submitted to Lindéngruppen so we would like to update you on the overall forecast financial performance as follows:
Net Sales
- Net Sales show 0.3% decrease vs Budget (-£0.5m), which represents -£3.5m vs the sum of the Business Unit budgets (a £3m sales de-risk being applied centrally in Budget).
- The key drivers of adverse sales are:
- France (-£1.5m, impacted by a lower landing in 2018 vs Budget assumption, driven to a large extent by social unrest, as well as a de-prioritisation / exit of the category by mass retailers)
- International (-£0.7m, impacted by economic conditions in a number of markets and distributor/retailer destocking)
- Elephant (-£0.6m, reflecting a revised view on the income generated from Elephant West).
- The YTD adverse sales vs Budget in the US are expected to recover in YTG (re-phasing of volumes directly imported from China by Michaels)
Gross Profit
- Gross Margin improves by 1.6ppt vs Budget generating +£2.2m Gross Profit vs Budget despite reduced sales. Key favourable impacts are:
- Reduced duties in the US as a result of (i) maintenance of 10% duty rate for Q1 and the impact of moving production of Liquitex Basics to Le Mans for H2 (Budget took a prudent assumption of 25% duty rate from 1st January for the full year)
- Continued pricing and mix focus
- Favourable PPVs offsetting volume inefficiencies plus continued tight cost base management across Operations
Opex
- We continue to review and prioritise Advertising and Promotion spend which has resulted in a net reduction of £0.6m in A&P spend for 2019 across the markets and Brands.
- Overheads show a significant reduction vs Budget as we continue to manage spend closely and prioritise role recruitment and other spend categories. Depreciation is also favourable vs Budget.
EAC
- We have forecast additional EAC in FC1 to reflect our latest view on US DC double running costs, likely remaining inventory of Reeves products at year end and optimisation of manufacturing footprint. These are offset by the impact of cleaning up certain balance sheet accruals and release of some of the US DC dilapidation provision.
EBIT
- The combined result of the above shows that EBIT improves vs Budget by £0.9m.
Operating Cashflow (OCF)
- FC1 OCF is +£0.1m vs Budget at +£5.6m:
- EBITDA is +£0.3m vs Budget – EBIT improvement of £0.9m includes £0.6m (net) of depreciation reduction
- “Other” is -£0.5m vs Budget – £0.4 impact of severance payments shown as provision movements (largely offset against working capital movement)
- Working capital is -£1.0m vs. Budget
➢ Provision included for unsaleable Reeves inventory on cessation
➢ Rundown of Arches inventory during Q3/Q4
➢ Non-cash P&L releases such as GRNI/US dilapidations ~
➢ Net increase in AR/AP – AR is significantly unfavourable resulting from actions taken in Q4 2018 and the impact of sales phasing into Q4 2019
- Net Capex is +£1m (i.e. lower spend) than Budget as a result of selected reductions in Ops and Tech (plus £0.1m Tech budgeted Capex re-categorised as Opex)
- Capitalised merchandising spend in the US reduces by £0.4m (Phase 2 Liquitex spend shows reduced scope and lower negotiated unit cost)
In summary we are well placed to deliver the financial performance for 2019 that we set out to achieve, although there is much to do in YTG to deliver our ambitions.
Regards,

Dennis Van Schie CEO